CATALYST BY HEAD2NET · ENTERPRISE BUSINESS INTELLIGENCE
Turning complex data workflows into a clearer self-service BI experience.
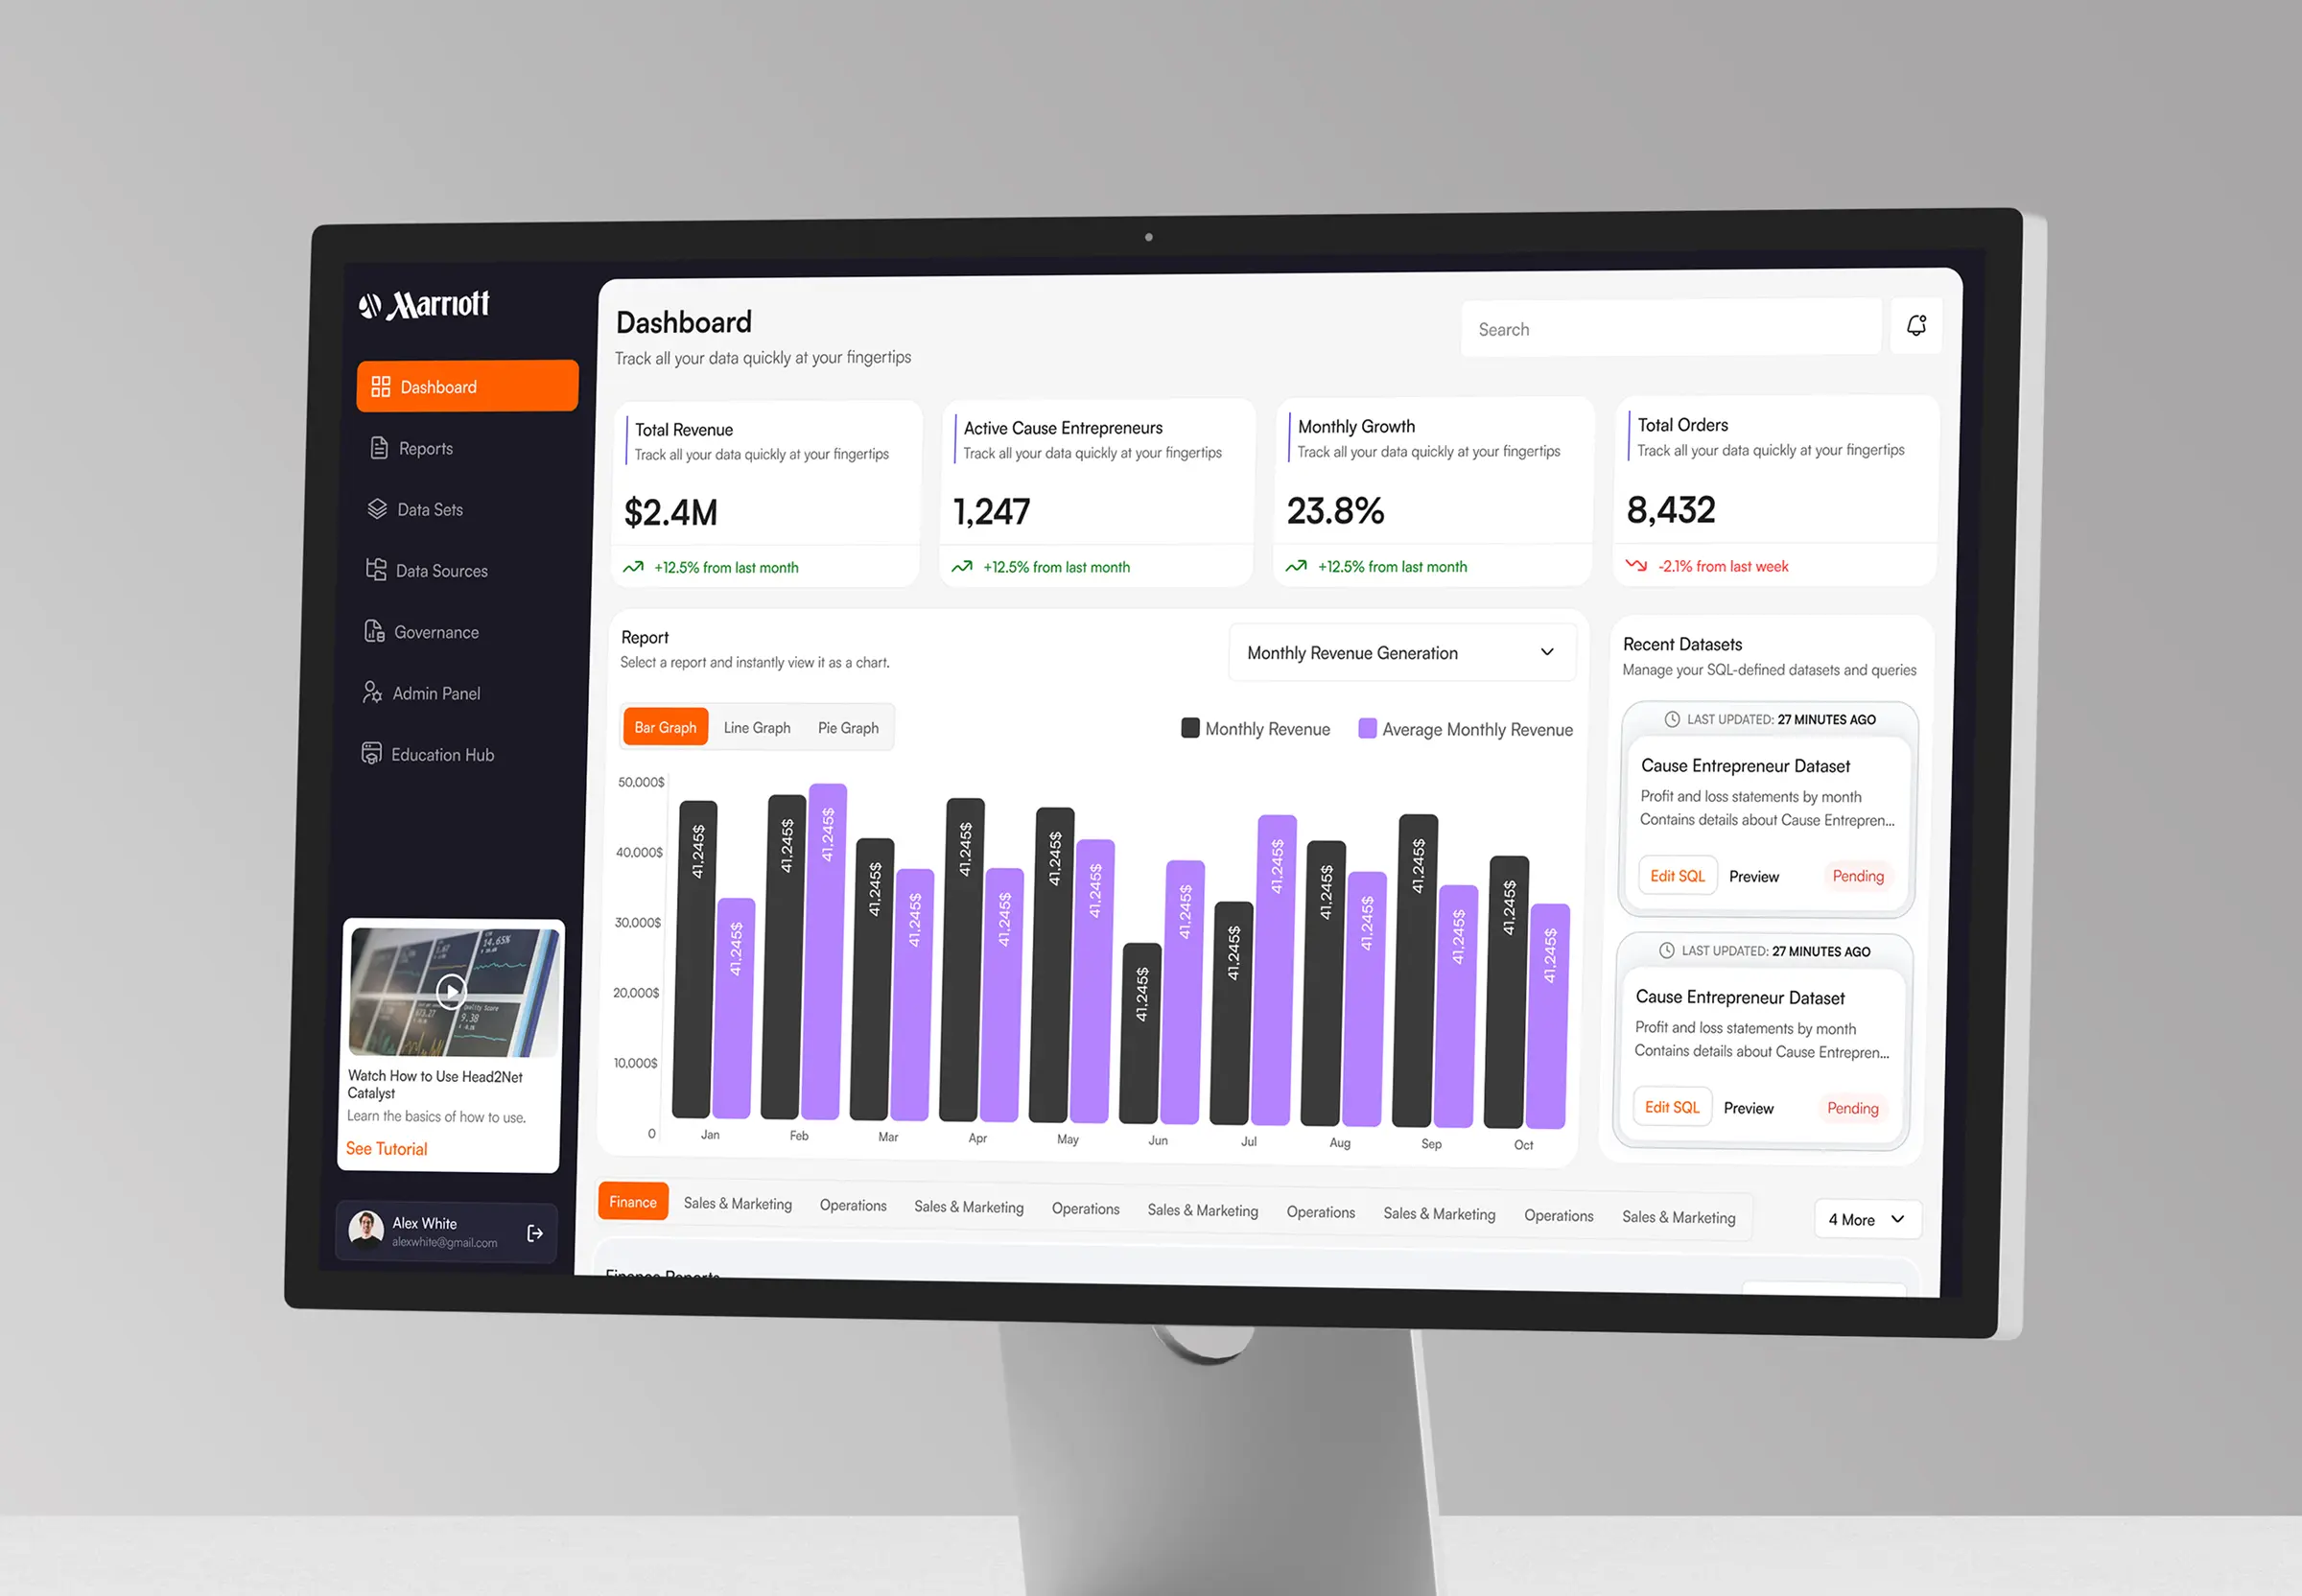
Head2Net envisioned Catalyst as a business-intelligence product that could bring data, reporting and governance together for organizations. The Merc designed its core product experience, translating technical requirements into structured, approachable workflows for business users and administrators.
Product UX/UI
Information Architecture
Dashboard
Reporting UX
Multi-role
Business + admin workflows
Data → Reports
Core product experience
Enterprise SaaS / Business Intelligence
Industry
Product design and Figma handoff
Engagement
CATALYST BY HEAD2NET · ENTERPRISE BUSINESS INTELLIGENCE
Turning complex data workflows into a clearer self-service BI experience.
Head2Net envisioned Catalyst as a business-intelligence product that could bring data, reporting and governance together for organizations. The Merc designed its core product experience, translating technical requirements into structured, approachable workflows for business users and administrators.
Product UX/UI
Information Architecture
Dashboard
Reporting UX
Multi-role
Business + admin workflows
Data → Reports
Core product experience
Enterprise SaaS / Business Intelligence
Industry
Product design and Figma handoff
Engagement
CATALYST BY HEAD2NET · ENTERPRISE BUSINESS INTELLIGENCE
Turning complex data workflows into a clearer self-service BI experience.
Head2Net envisioned Catalyst as a business-intelligence product that could bring data, reporting and governance together for organizations. The Merc designed its core product experience, translating technical requirements into structured, approachable workflows for business users and administrators.
Product UX/UI
Information Architecture
Dashboard
Reporting UX
Multi-role
Business + admin workflows
Data → Reports
Core product experience
Enterprise SaaS / Business Intelligence
Industry
Product design and Figma handoff
Engagement
01 — STARTING POINT
A technically powerful idea needed a usable product experience.
Head2Net came with product requirements and early AI-generated visual directions for Catalyst.
The challenge was translating technical BI capabilities into an experience business teams could understand without constantly relying on data specialists.
Data connections, datasets, reporting, governance and administration all needed to work within one coherent product.
01 — STARTING POINT
A technically powerful idea needed a usable product experience.
Head2Net came with product requirements and early AI-generated visual directions for Catalyst.
The challenge was translating technical BI capabilities into an experience business teams could understand without constantly relying on data specialists.
Data connections, datasets, reporting, governance and administration all needed to work within one coherent product.
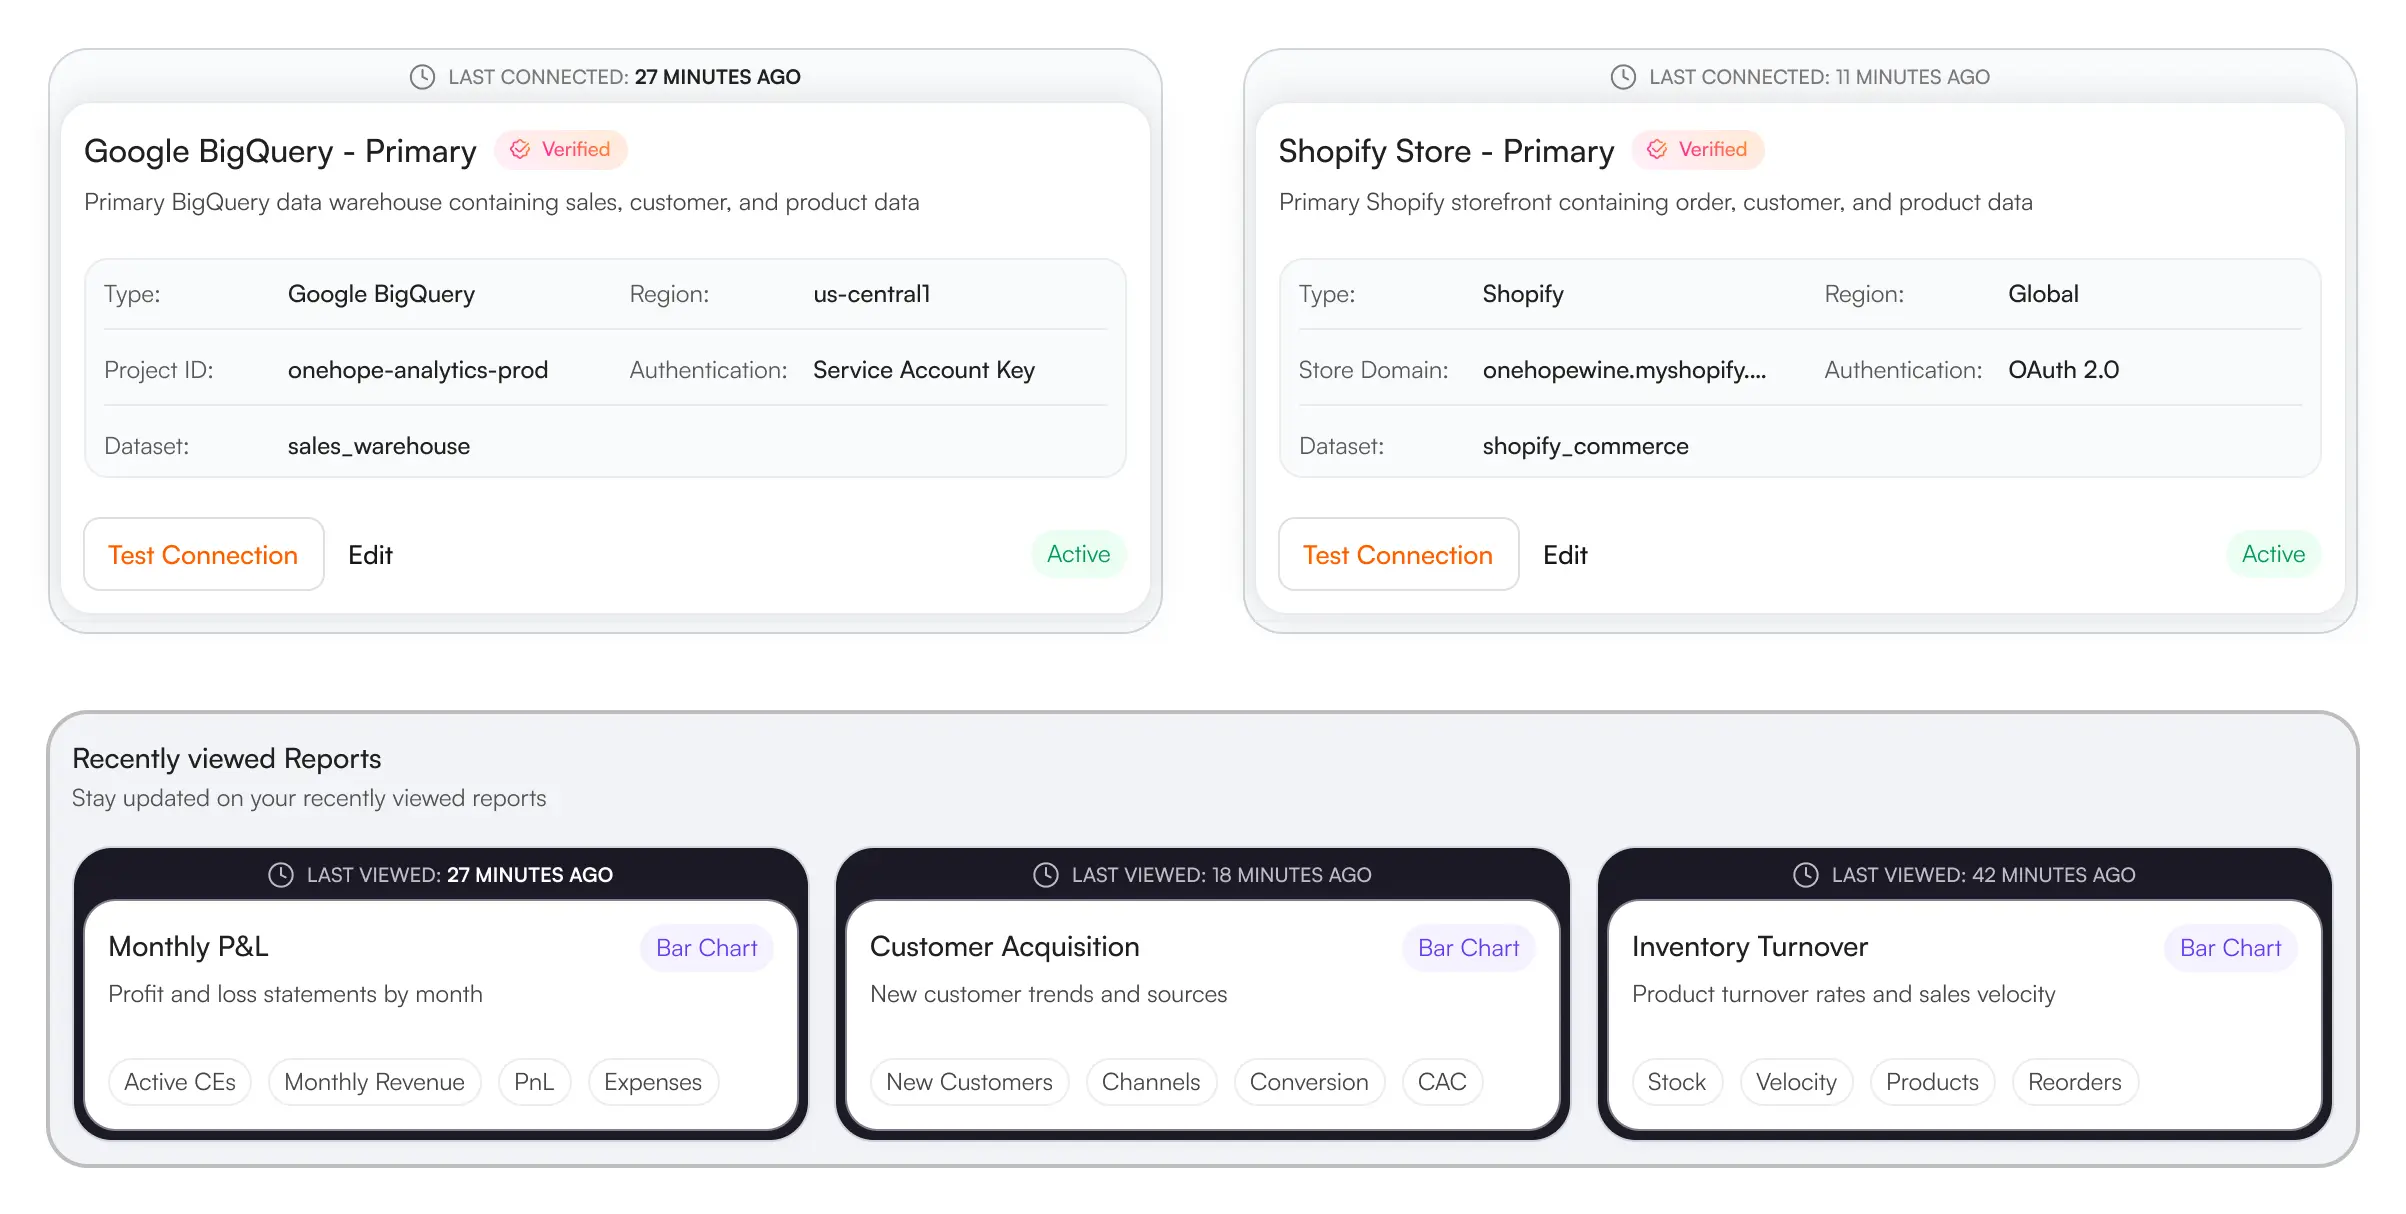
Catalyst data-source connection and recent-report states.
Catalyst data-source connection and recent-report states.
02 - PRODUCT ARCHITECTURE
Giving complex capabilities a clearer structure.
Catalyst brought together several interconnected functions, but not every user needed to understand the technical details behind them.
We organized the experience around distinct tasks: managing data sources, working with datasets, creating reports, understanding data definitions and controlling access.
The result was a clearer route through the product for business users and administrators.
02 - PRODUCT ARCHITECTURE
Giving complex capabilities a clearer structure.
Catalyst brought together several interconnected functions, but not every user needed to understand the technical details behind them.
We organized the experience around distinct tasks: managing data sources, working with datasets, creating reports, understanding data definitions and controlling access.
The result was a clearer route through the product for business users and administrators.
03 - DATA MANAGEMENT
Making technical data manageable for business users.
Connecting a data source and working with a dataset are two different tasks.
We designed distinct experiences for managing connections to platforms such as BigQuery and Snowflake, then organizing that information into datasets that could support reporting.
Connection details, status indicators and dataset controls were structured to make these tasks easier to understand and manage.
03 - DATA MANAGEMENT
Making technical data manageable for business users.
Connecting a data source and working with a dataset are two different tasks.
We designed distinct experiences for managing connections to platforms such as BigQuery and Snowflake, then organizing that information into datasets that could support reporting.
Connection details, status indicators and dataset controls were structured to make these tasks easier to understand and manage.
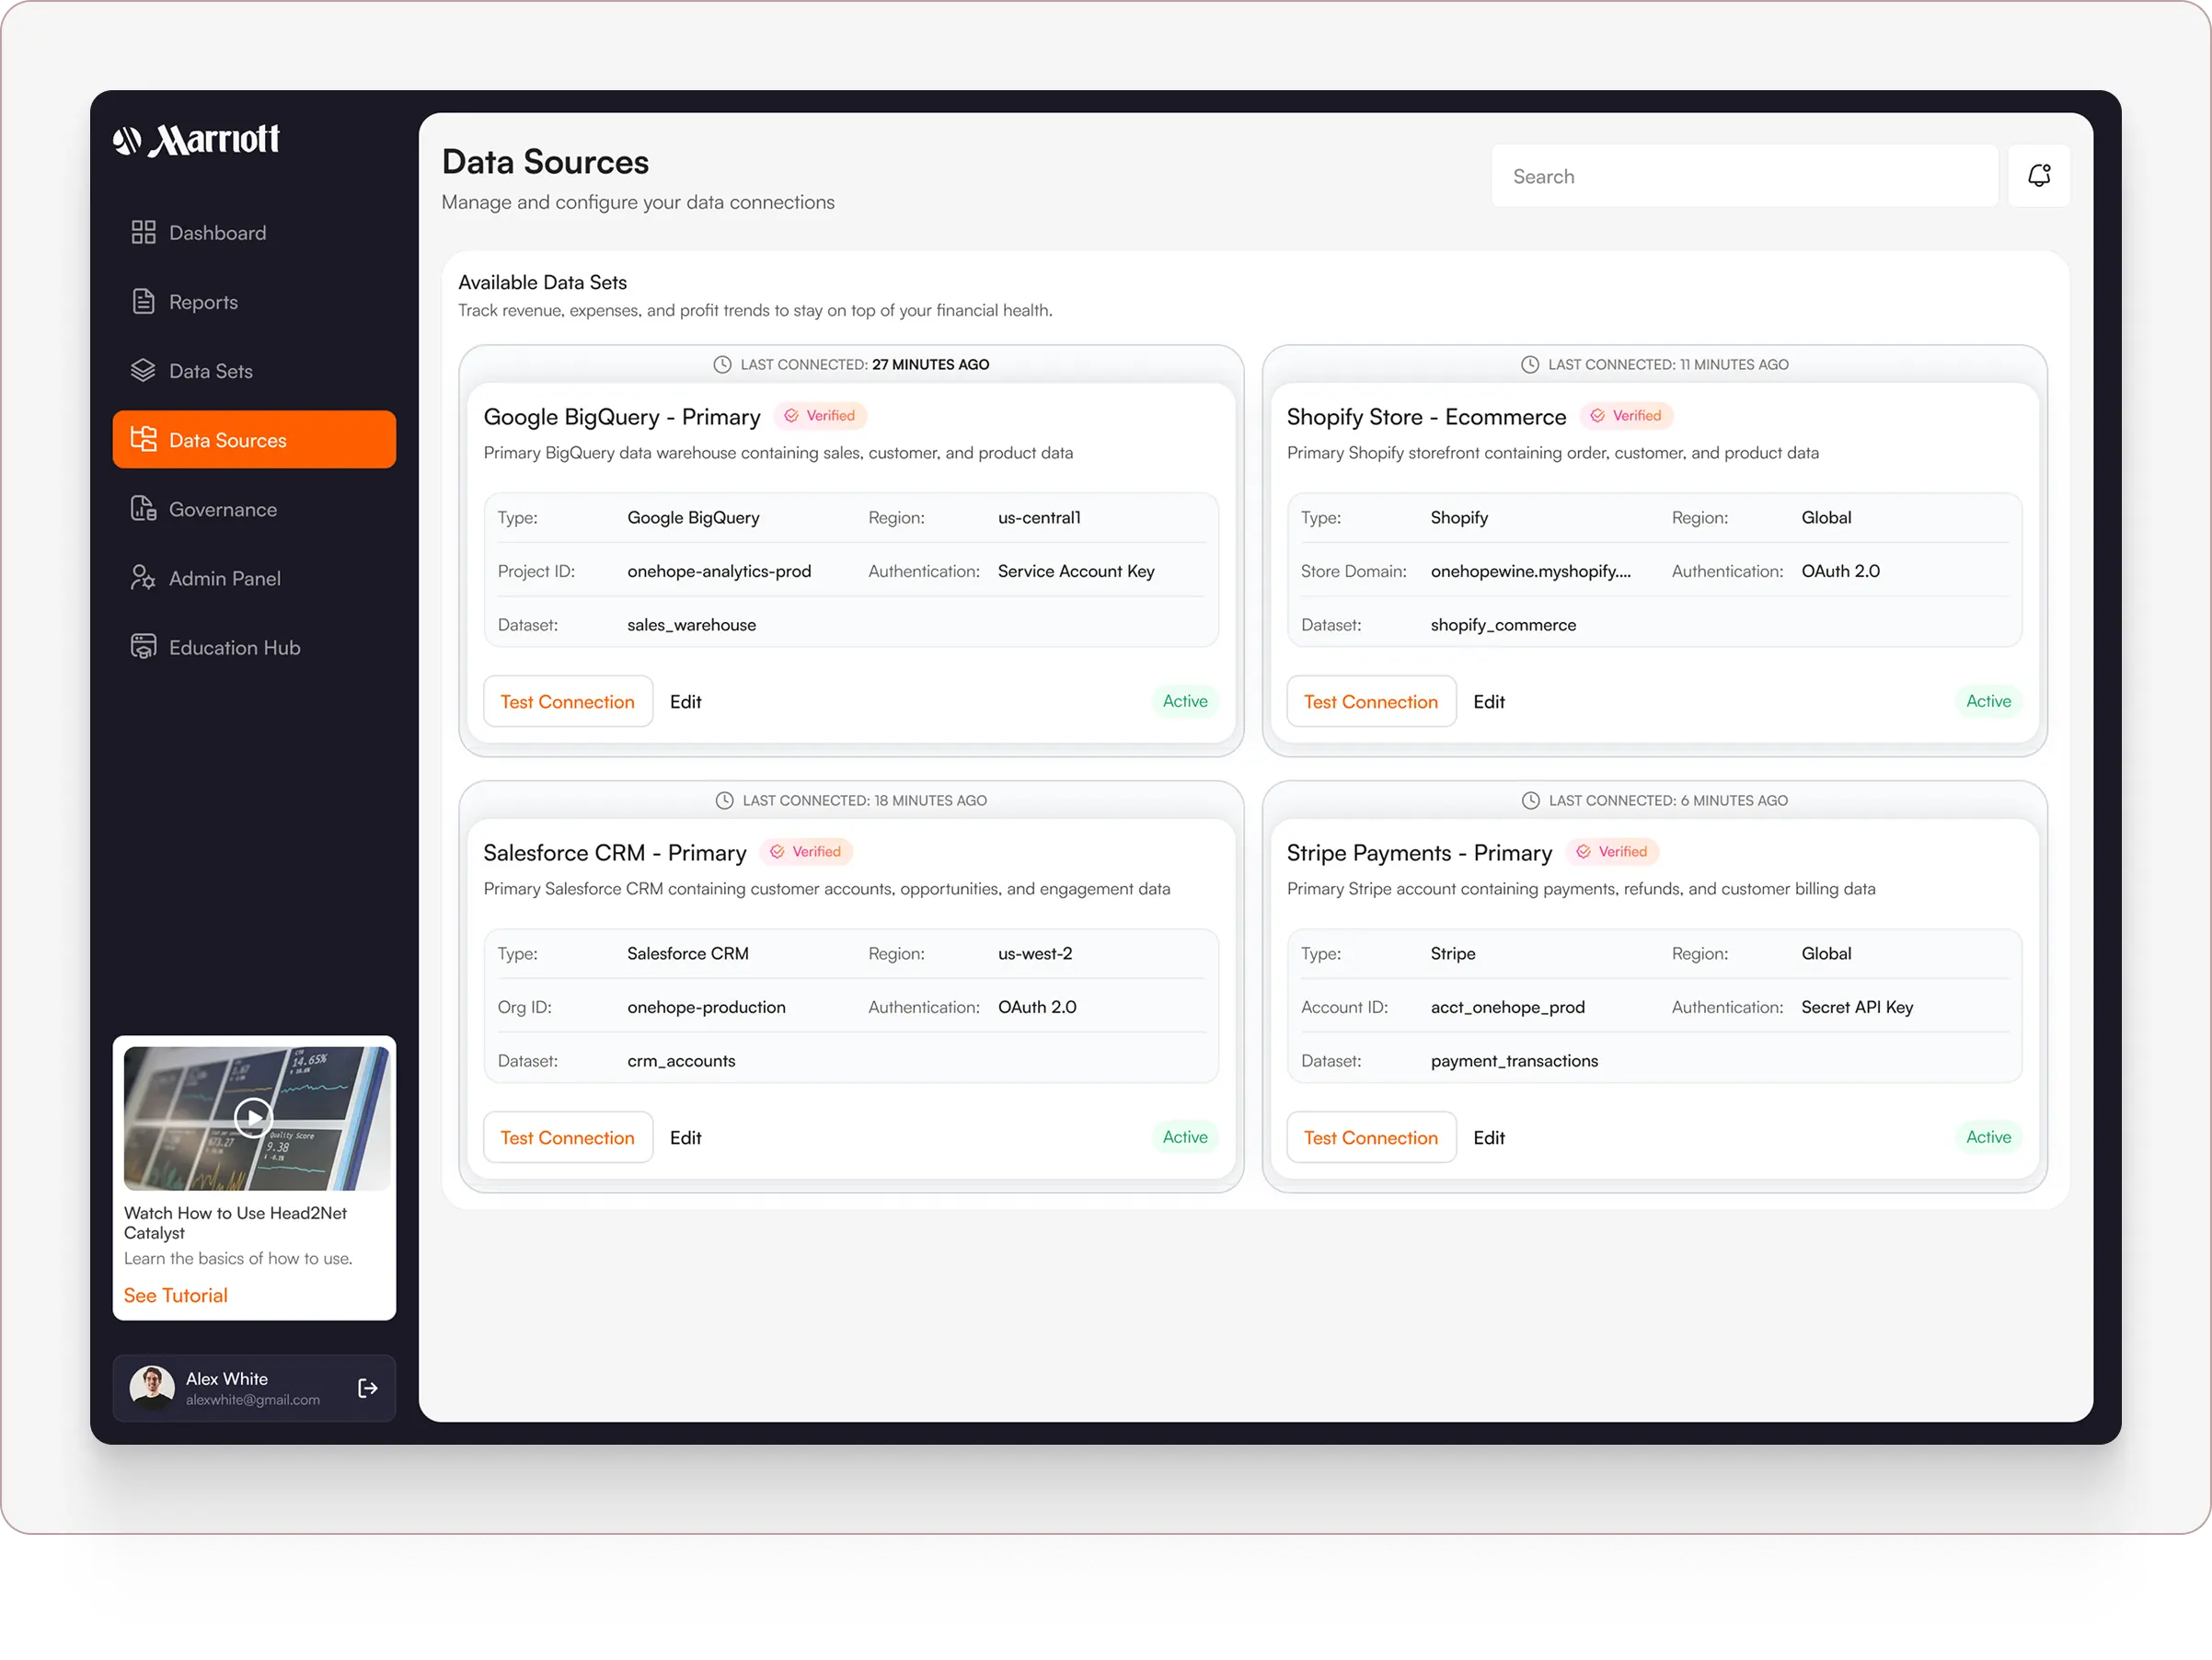
Connection details, verification status and configuration actions organized within one interface.
Connection details, verification status and configuration actions organized within one interface.
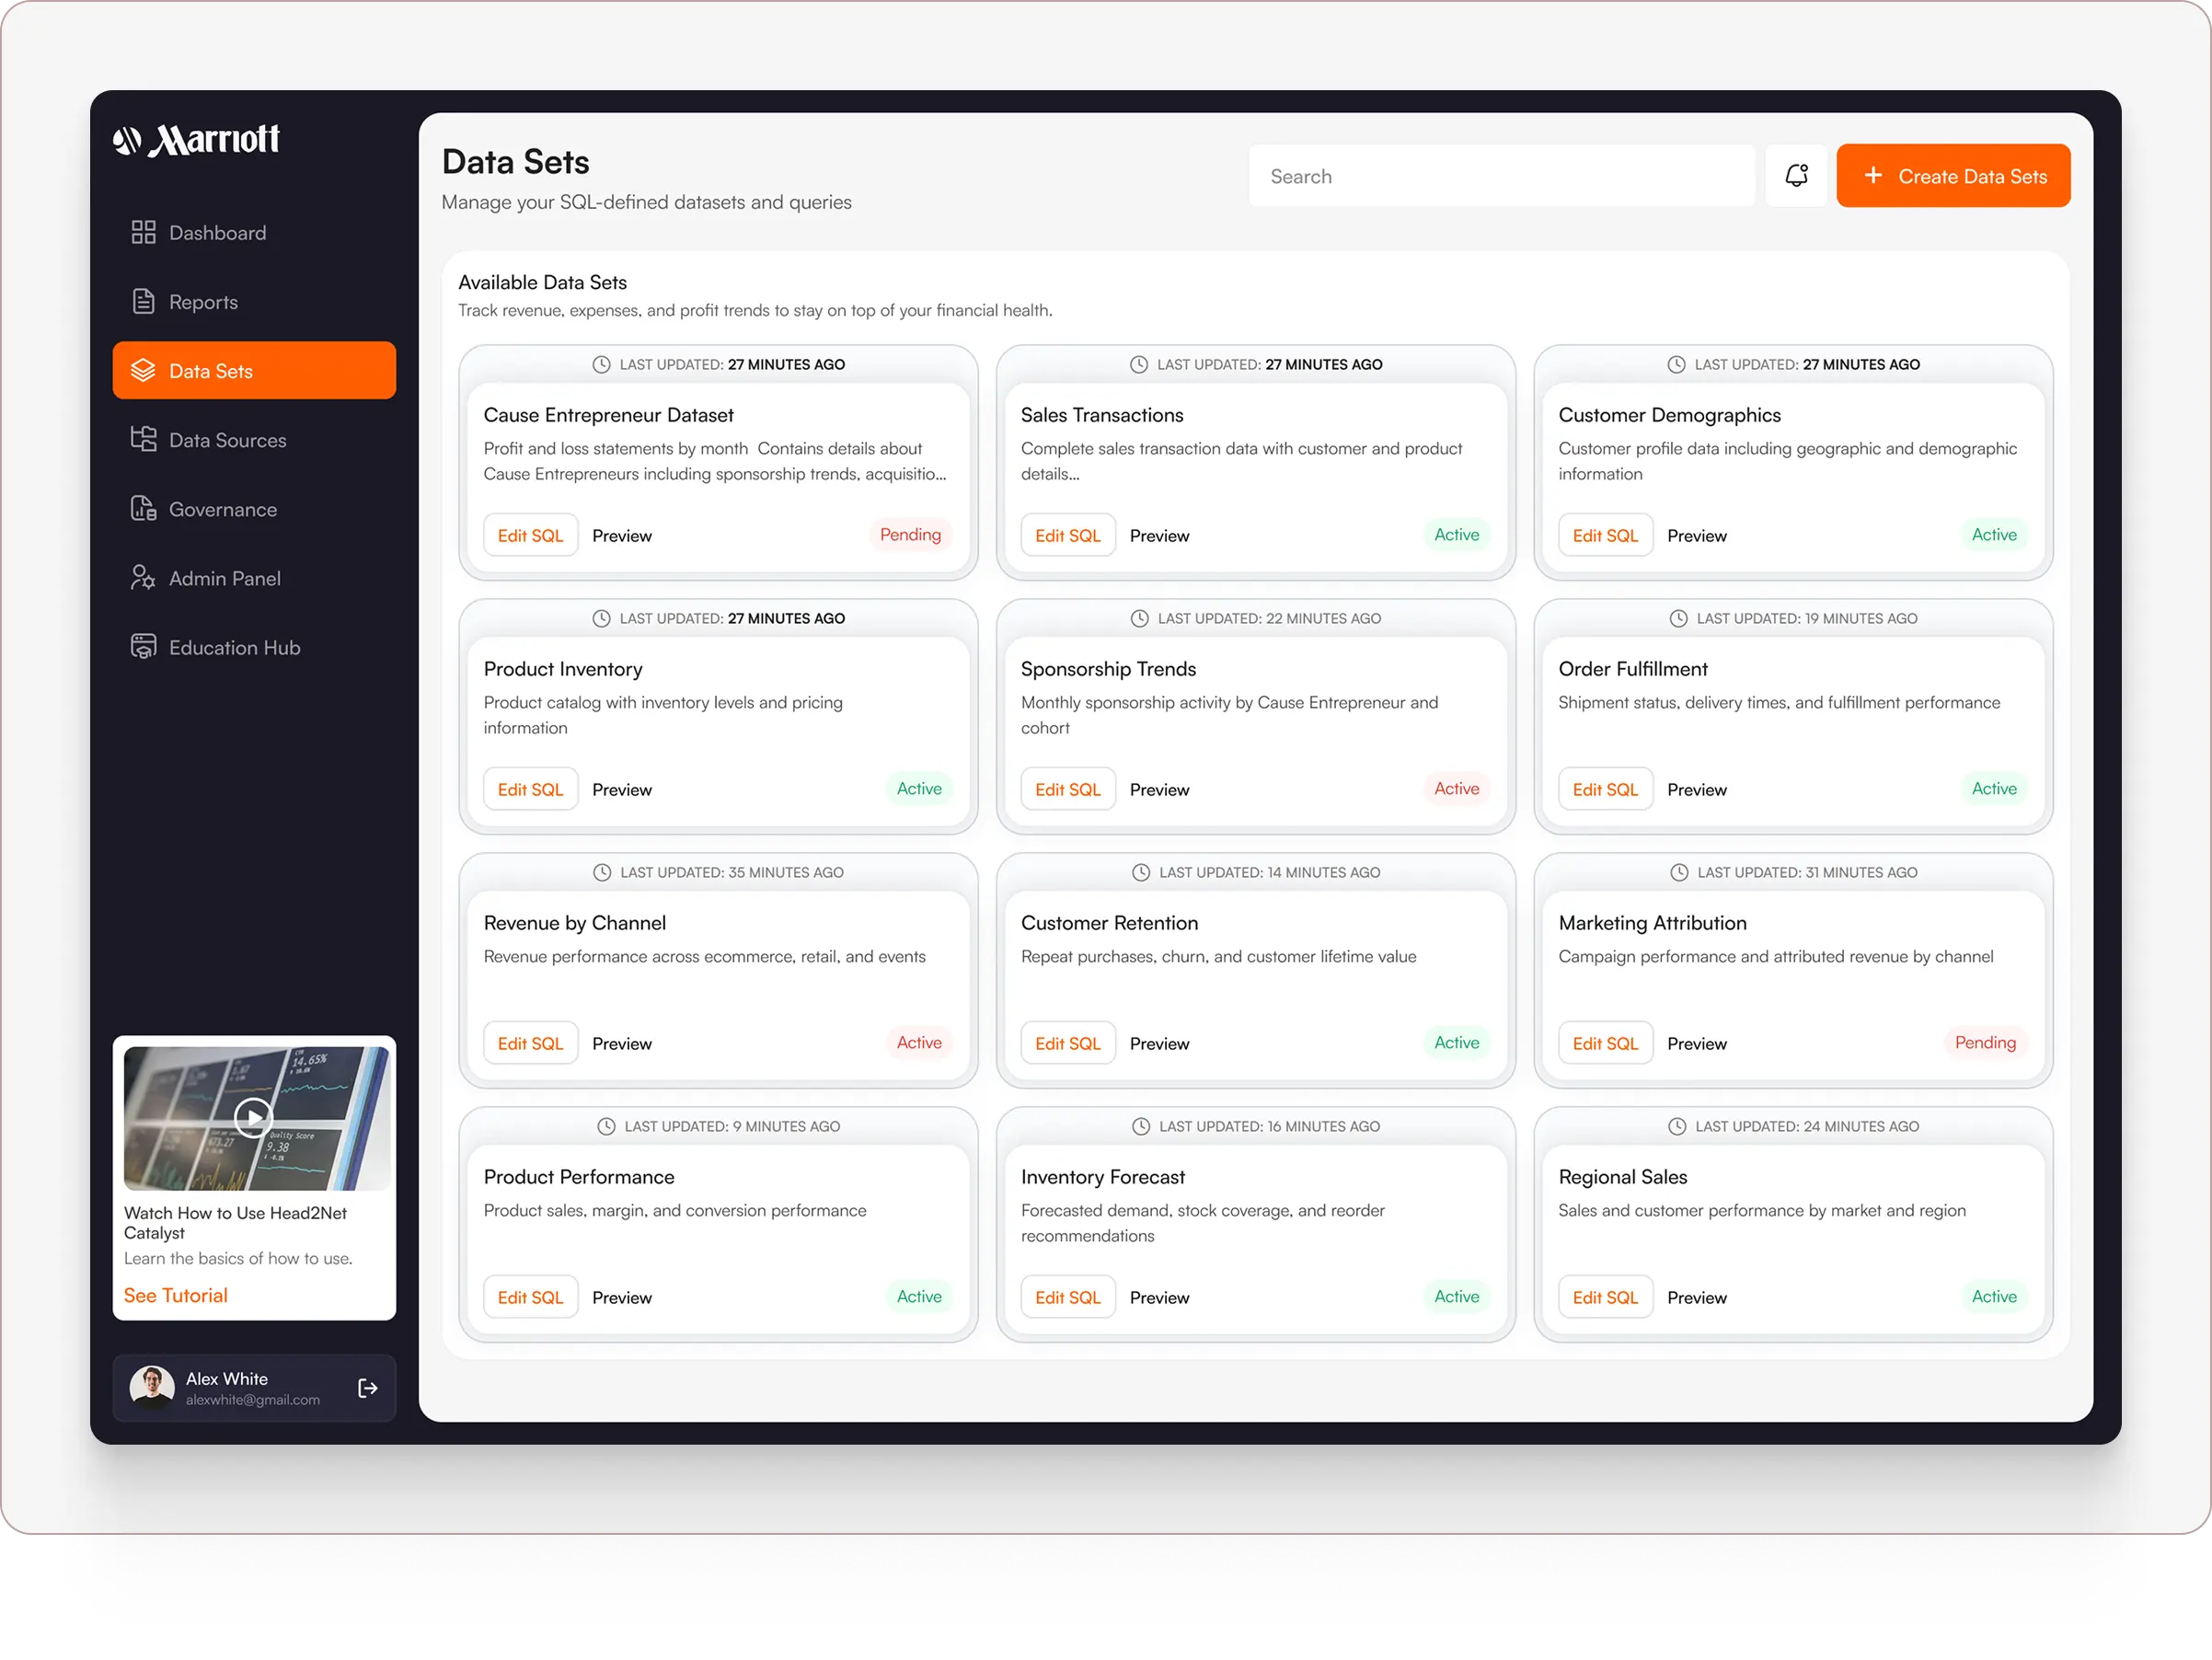
Datasets presented as manageable resources rather than exposing every underlying technical detail at once.
Datasets presented as manageable resources rather than exposing every underlying technical detail at once.
04 - REPORTING EXPERIENCE
Bringing reporting closer to the teams who need it.
One of Catalyst's central goals was to reduce routine dependence on technical teams for business reporting.
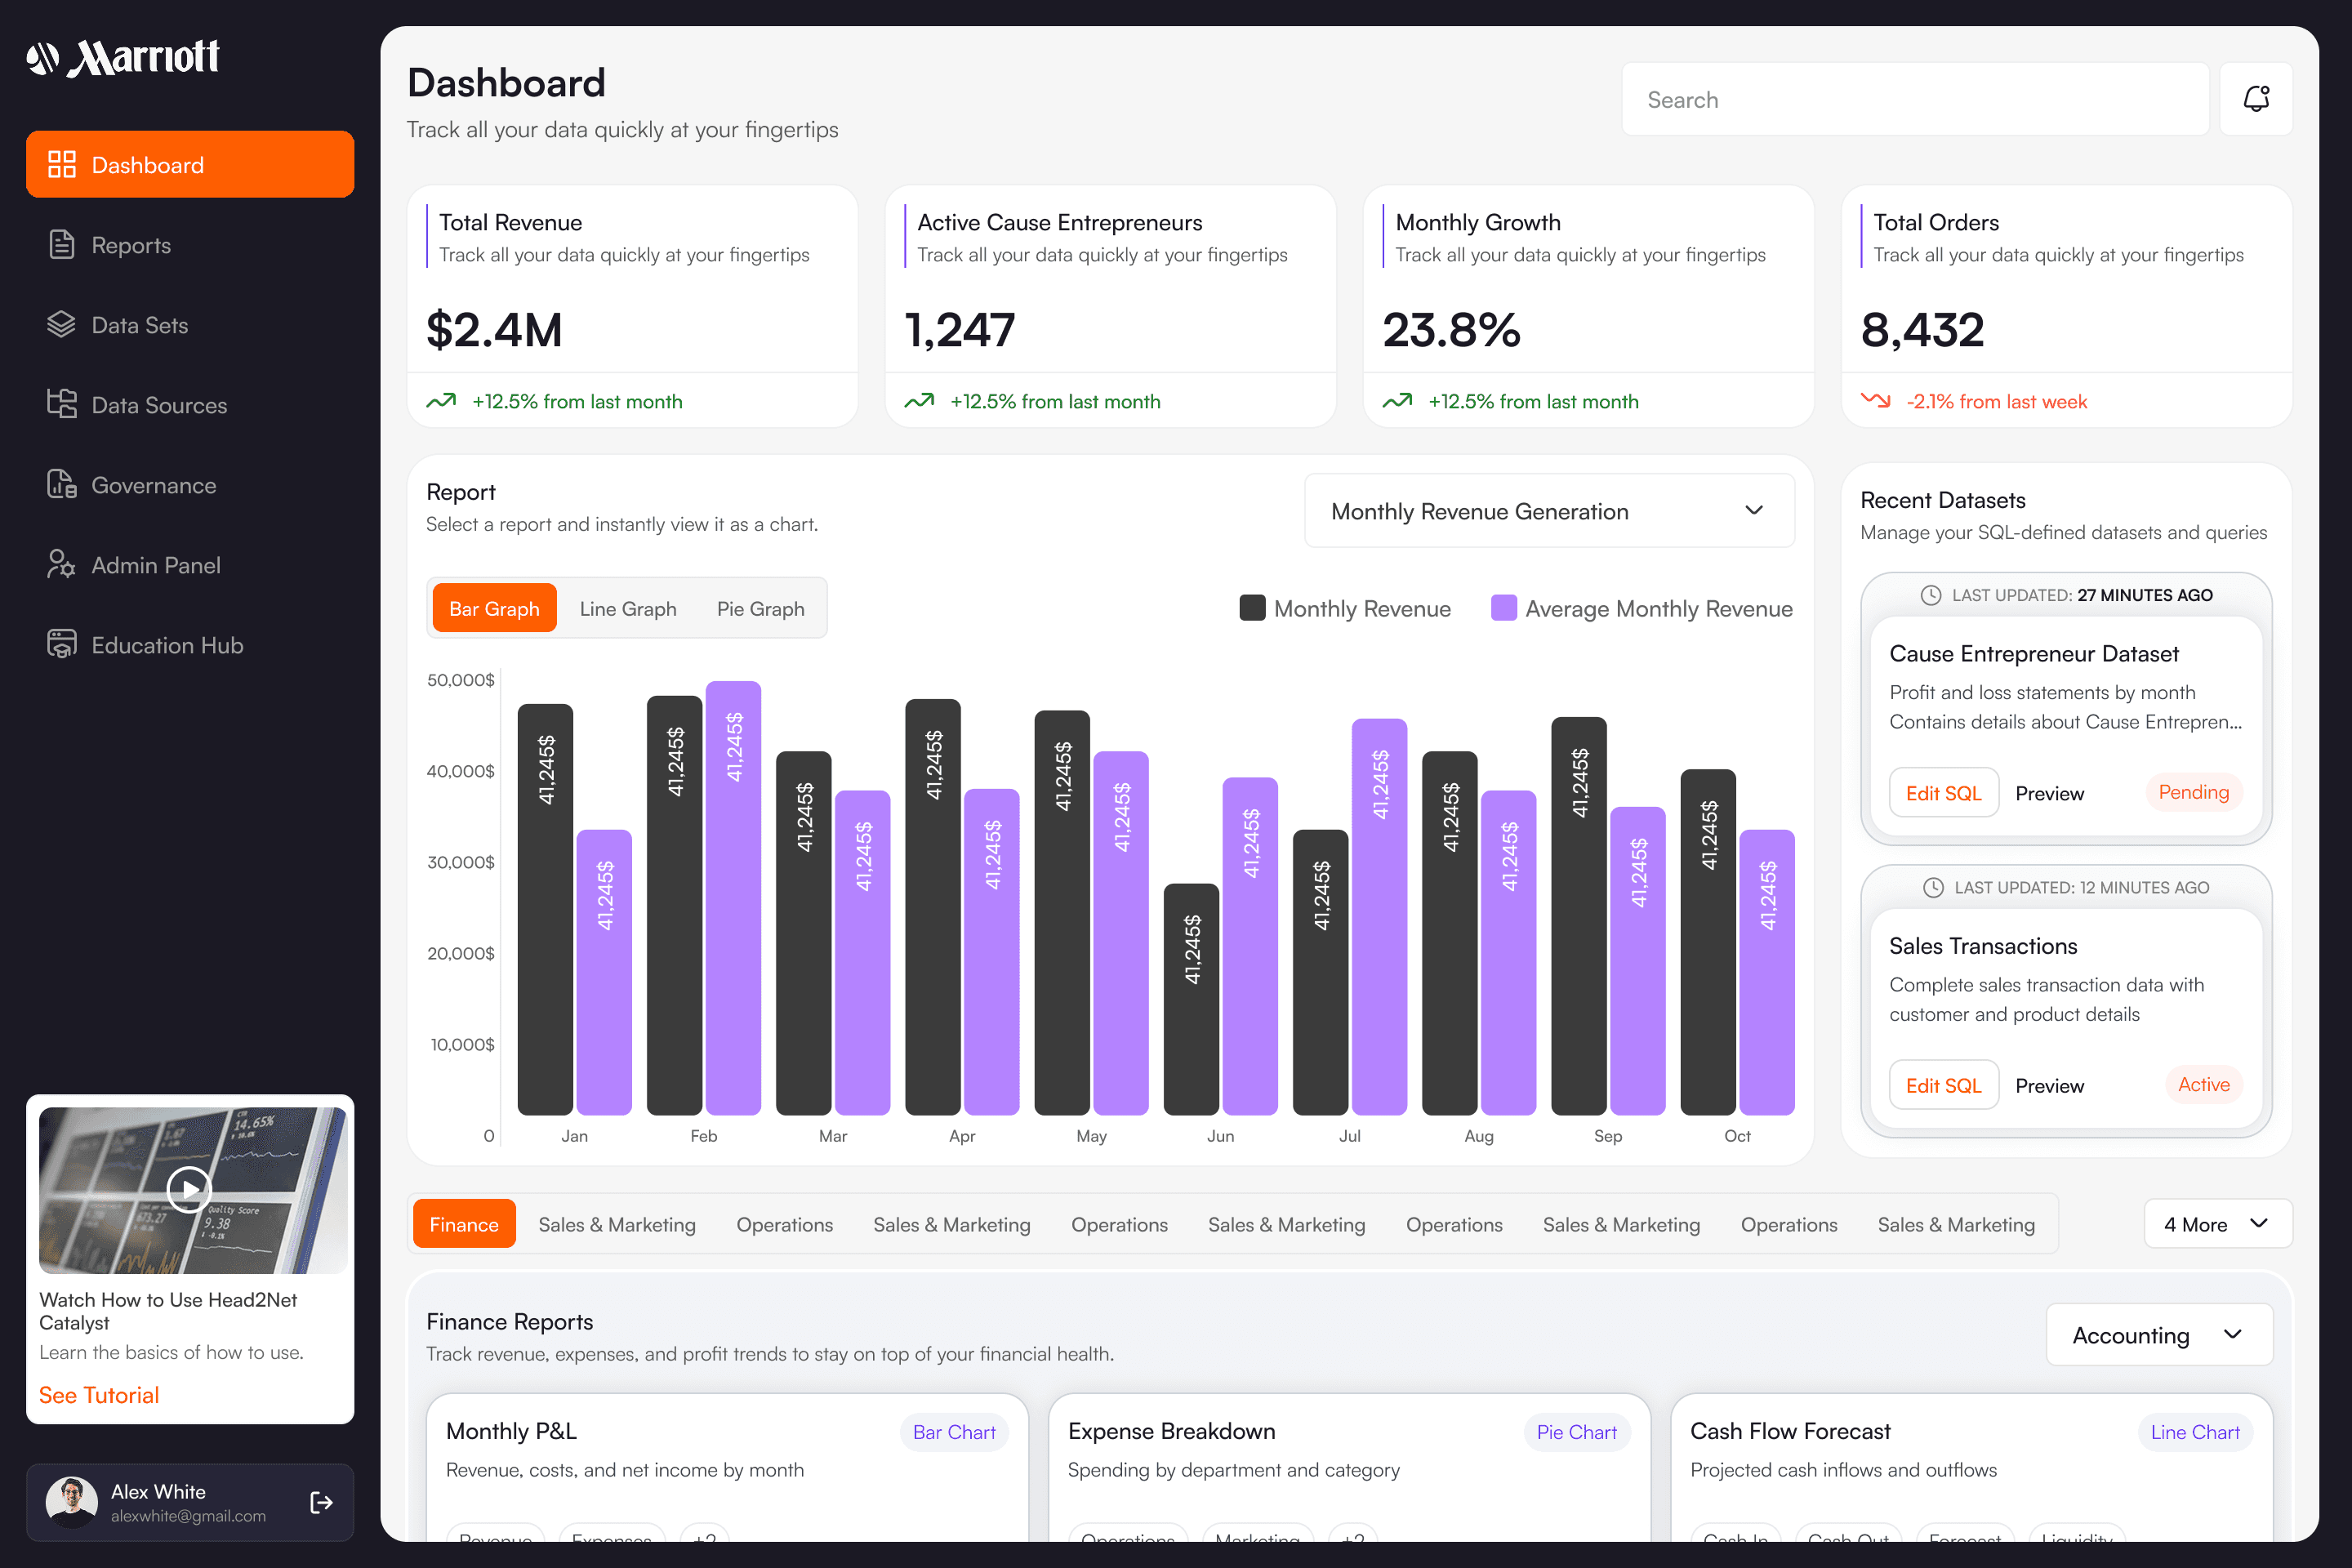
We designed an experience where users could explore available reports, work with datasets, configure charts and KPIs, and create reports relevant to their responsibilities.
The dashboard brought important metrics and reporting activity into one place, while the report library helped users find and manage their analytical work.
04 - REPORTING EXPERIENCE
Bringing reporting closer to the teams who need it.
One of Catalyst's central goals was to reduce routine dependence on technical teams for business reporting.
We designed an experience where users could explore available reports, work with datasets, configure charts and KPIs, and create reports relevant to their responsibilities.
The dashboard brought important metrics and reporting activity into one place, while the report library helped users find and manage their analytical work.

05 - DATA GOVERNANCE
Making data easier to understand — and access easier to control.
Business users needed understandable information. Administrators needed visibility into how that information was defined, connected and accessed.
We designed governance and administration experiences that brought business-friendly definitions alongside technical fields, data sources and lineage.
Role management and access controls supported the different responsibilities within the platform.
05 - DATA GOVERNANCE
Making data easier to understand — and access easier to control.
Business users needed understandable information. Administrators needed visibility into how that information was defined, connected and accessed.
We designed governance and administration experiences that brought business-friendly definitions alongside technical fields, data sources and lineage.
Role management and access controls supported the different responsibilities within the platform.
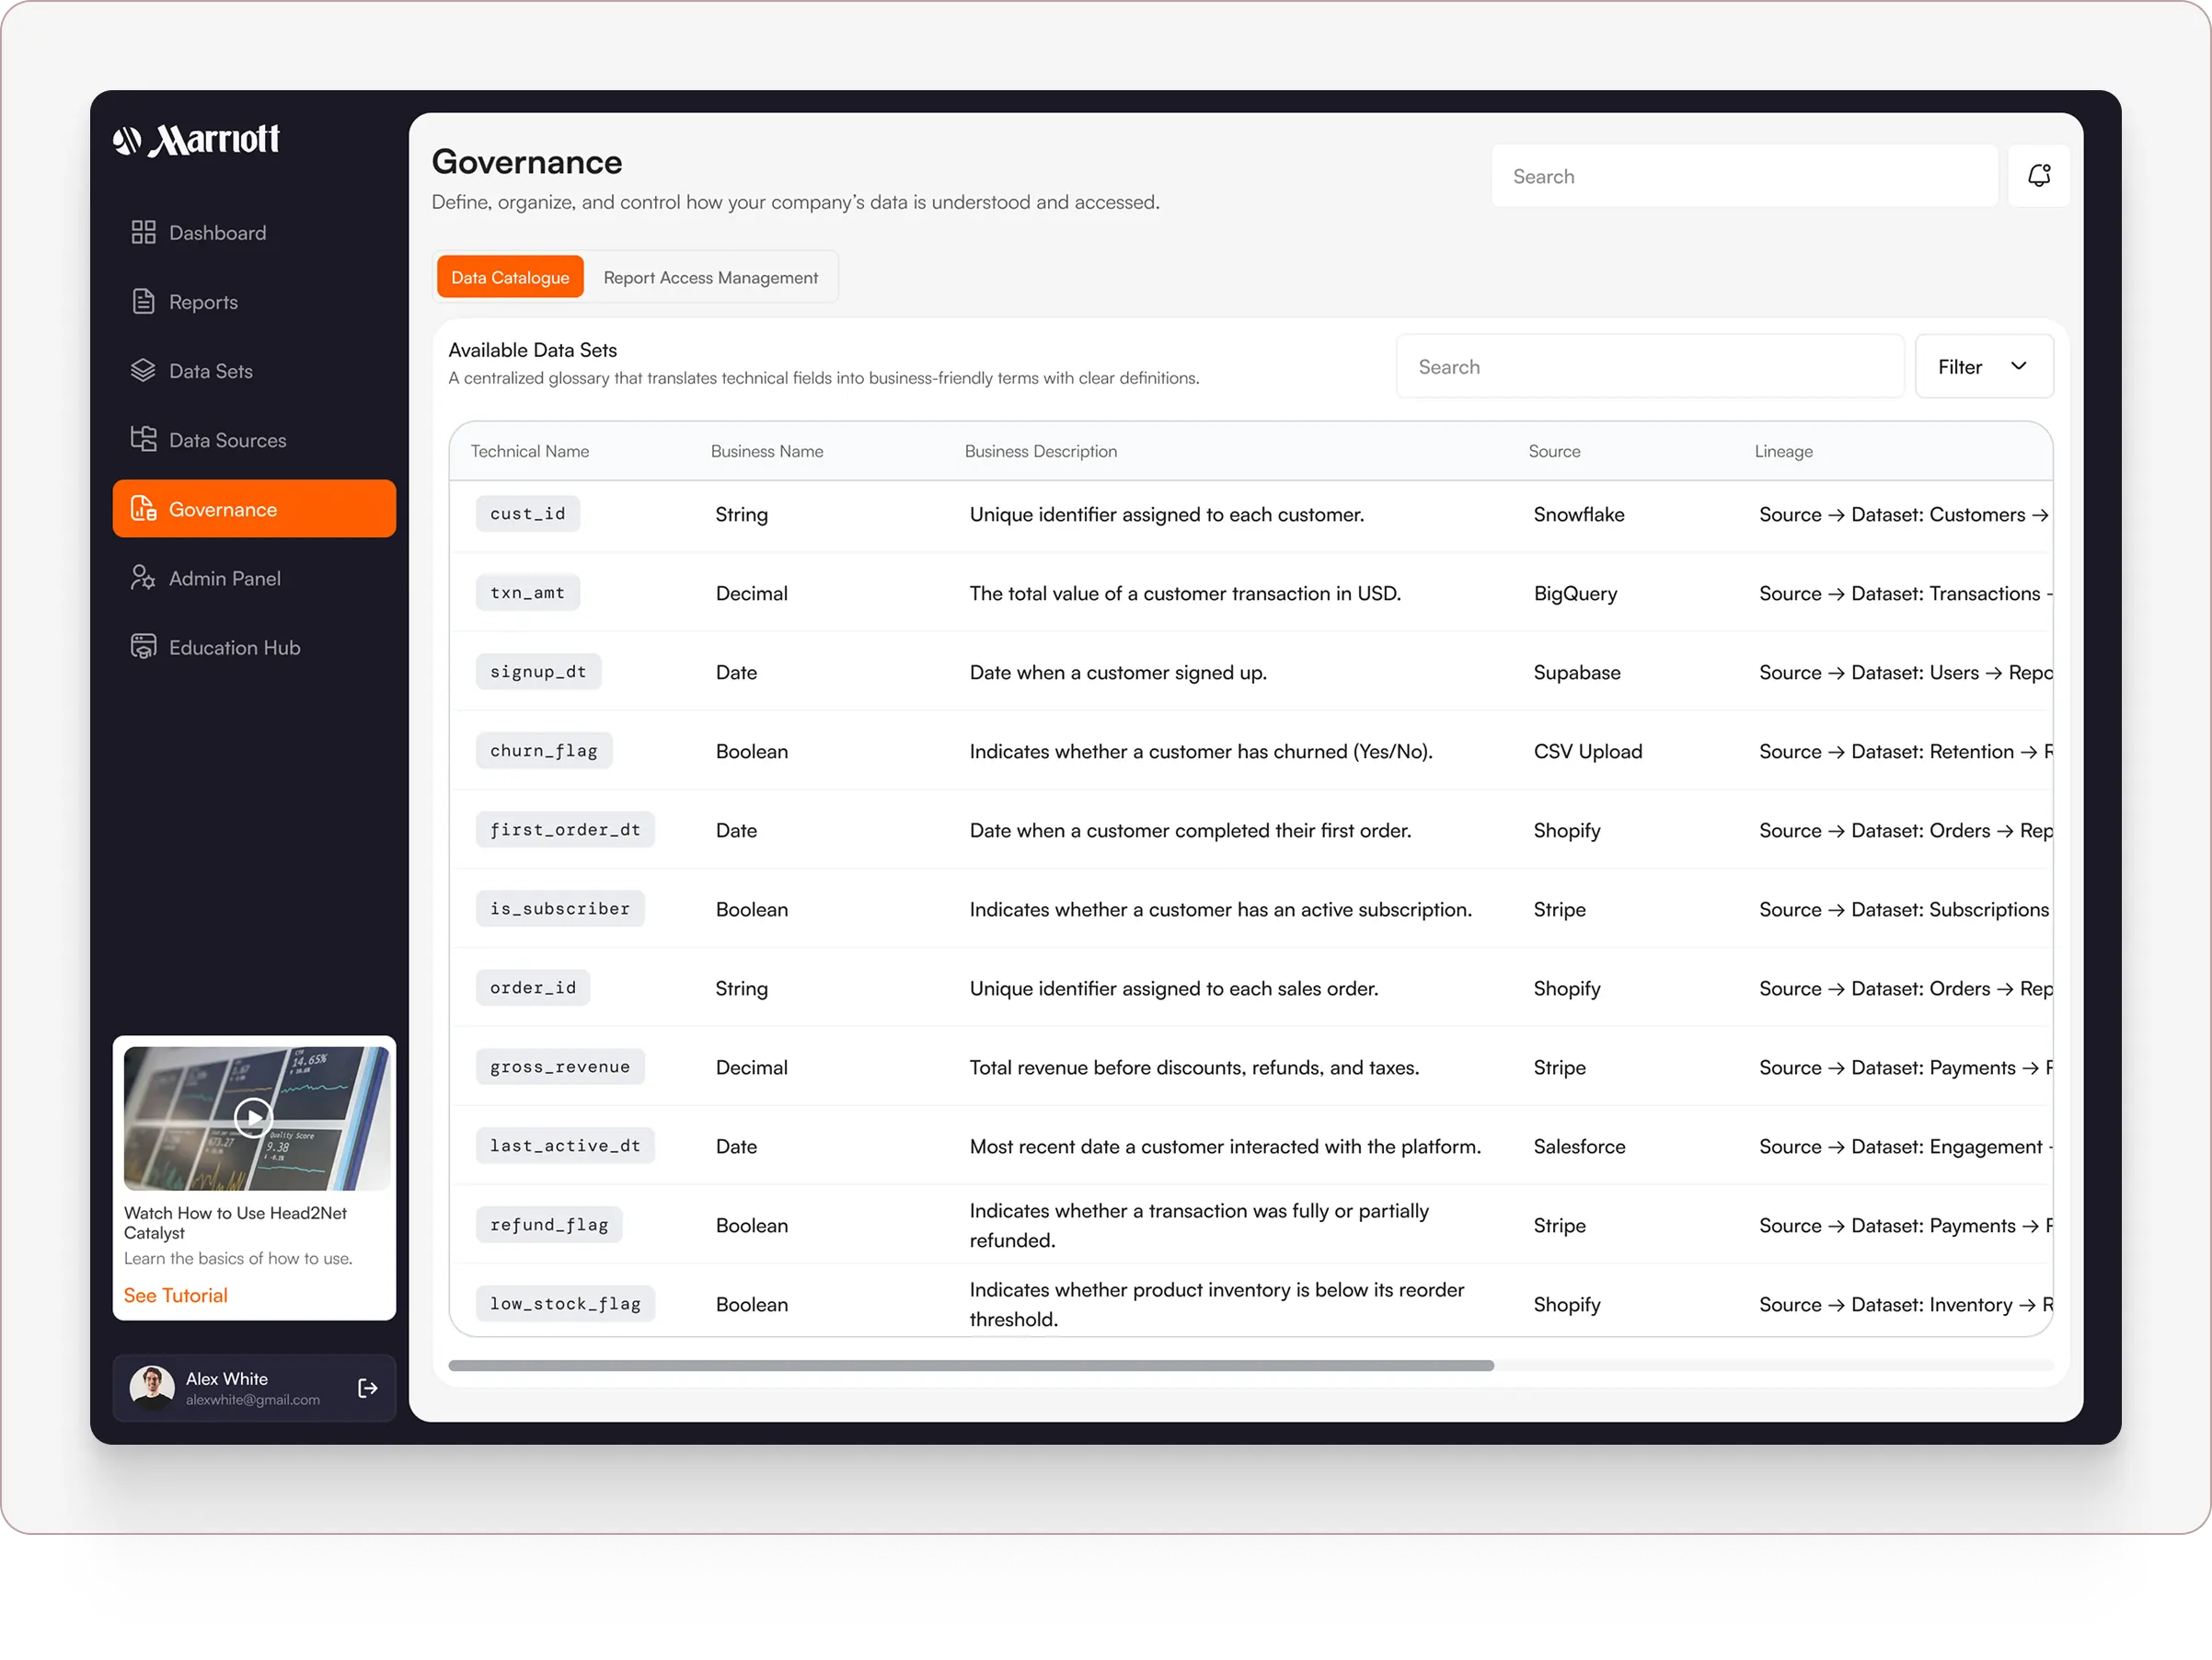
Governance translates technical data into business-readable definitions
Governance translates technical data into business-readable definitions
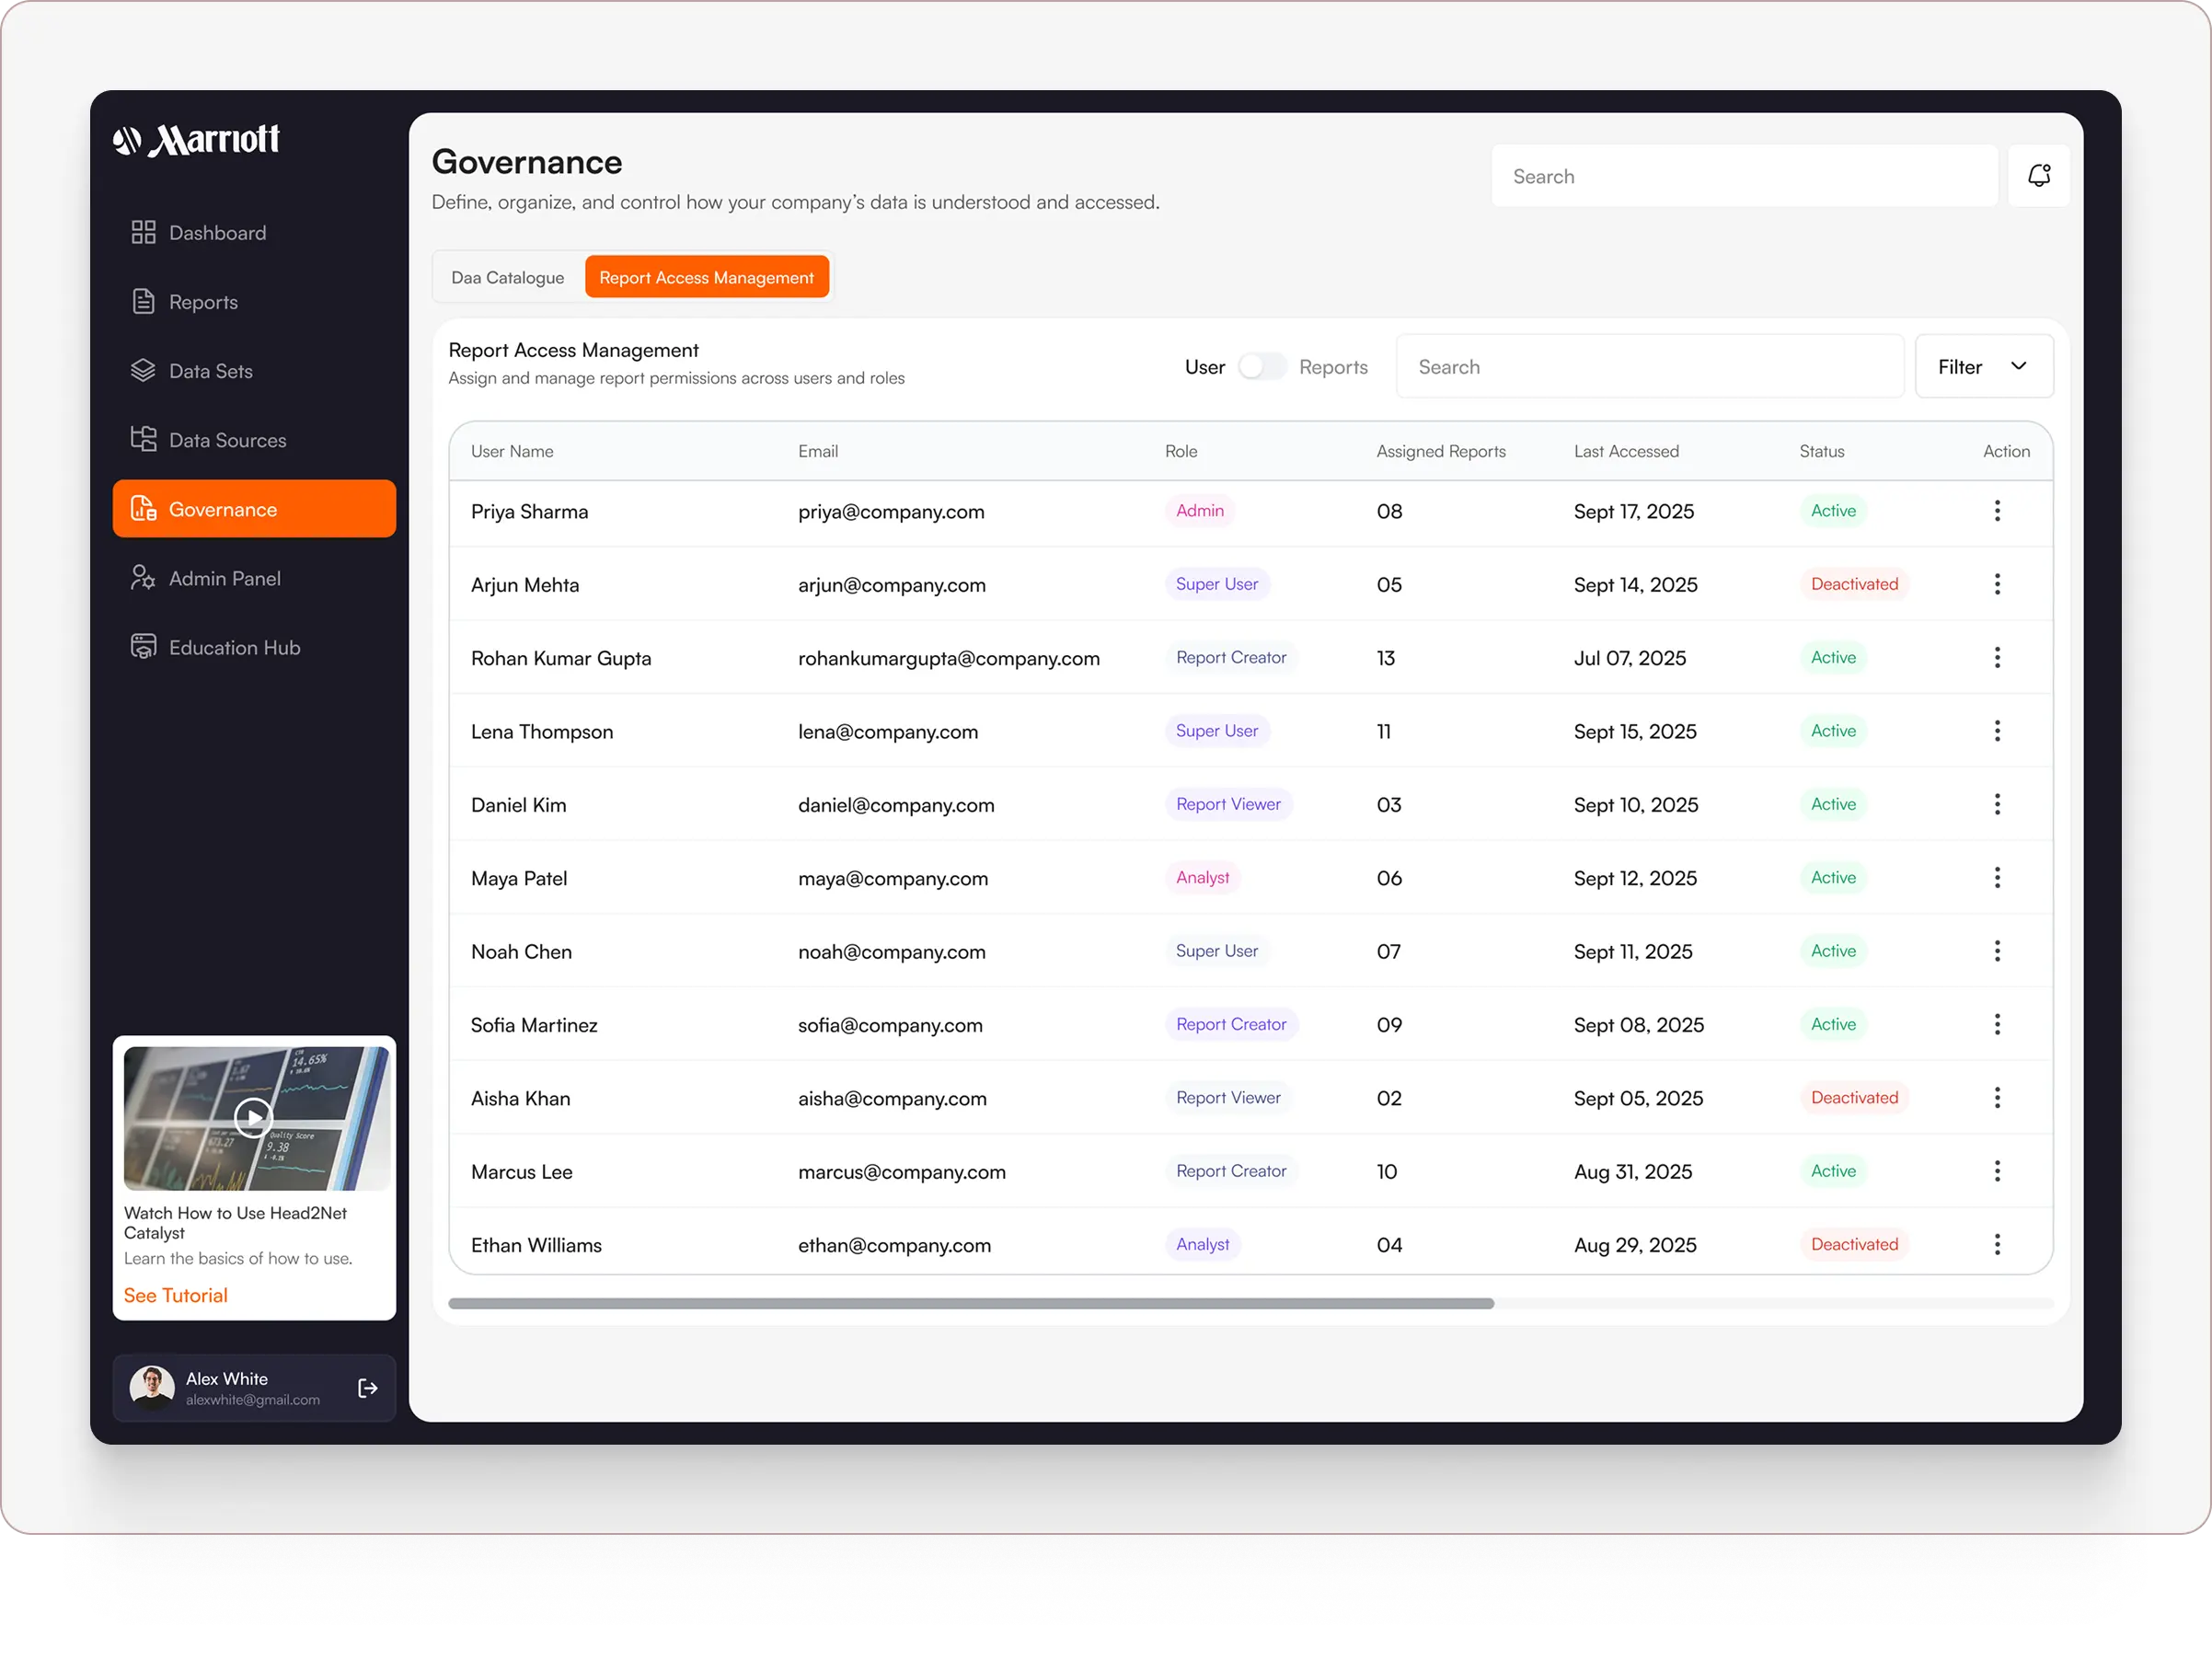
administration manages who can access the platform.
administration manages who can access the platform.
06 - PRODUCT ADOPTION
Self-service needs guidance, not just a simpler interface.
A powerful BI platform still requires users to learn unfamiliar concepts and workflows.
The Education Hub was designed to bring that guidance into the product, covering data connections, reporting, dashboards and user roles.
This gave users a dedicated place to learn how to work with Catalyst as they explored its capabilities.
06 - PRODUCT ADOPTION
Self-service needs guidance, not just a simpler interface.
A powerful BI platform still requires users to learn unfamiliar concepts and workflows.
The Education Hub was designed to bring that guidance into the product, covering data connections, reporting, dashboards and user roles.
This gave users a dedicated place to learn how to work with Catalyst as they explored its capabilities.
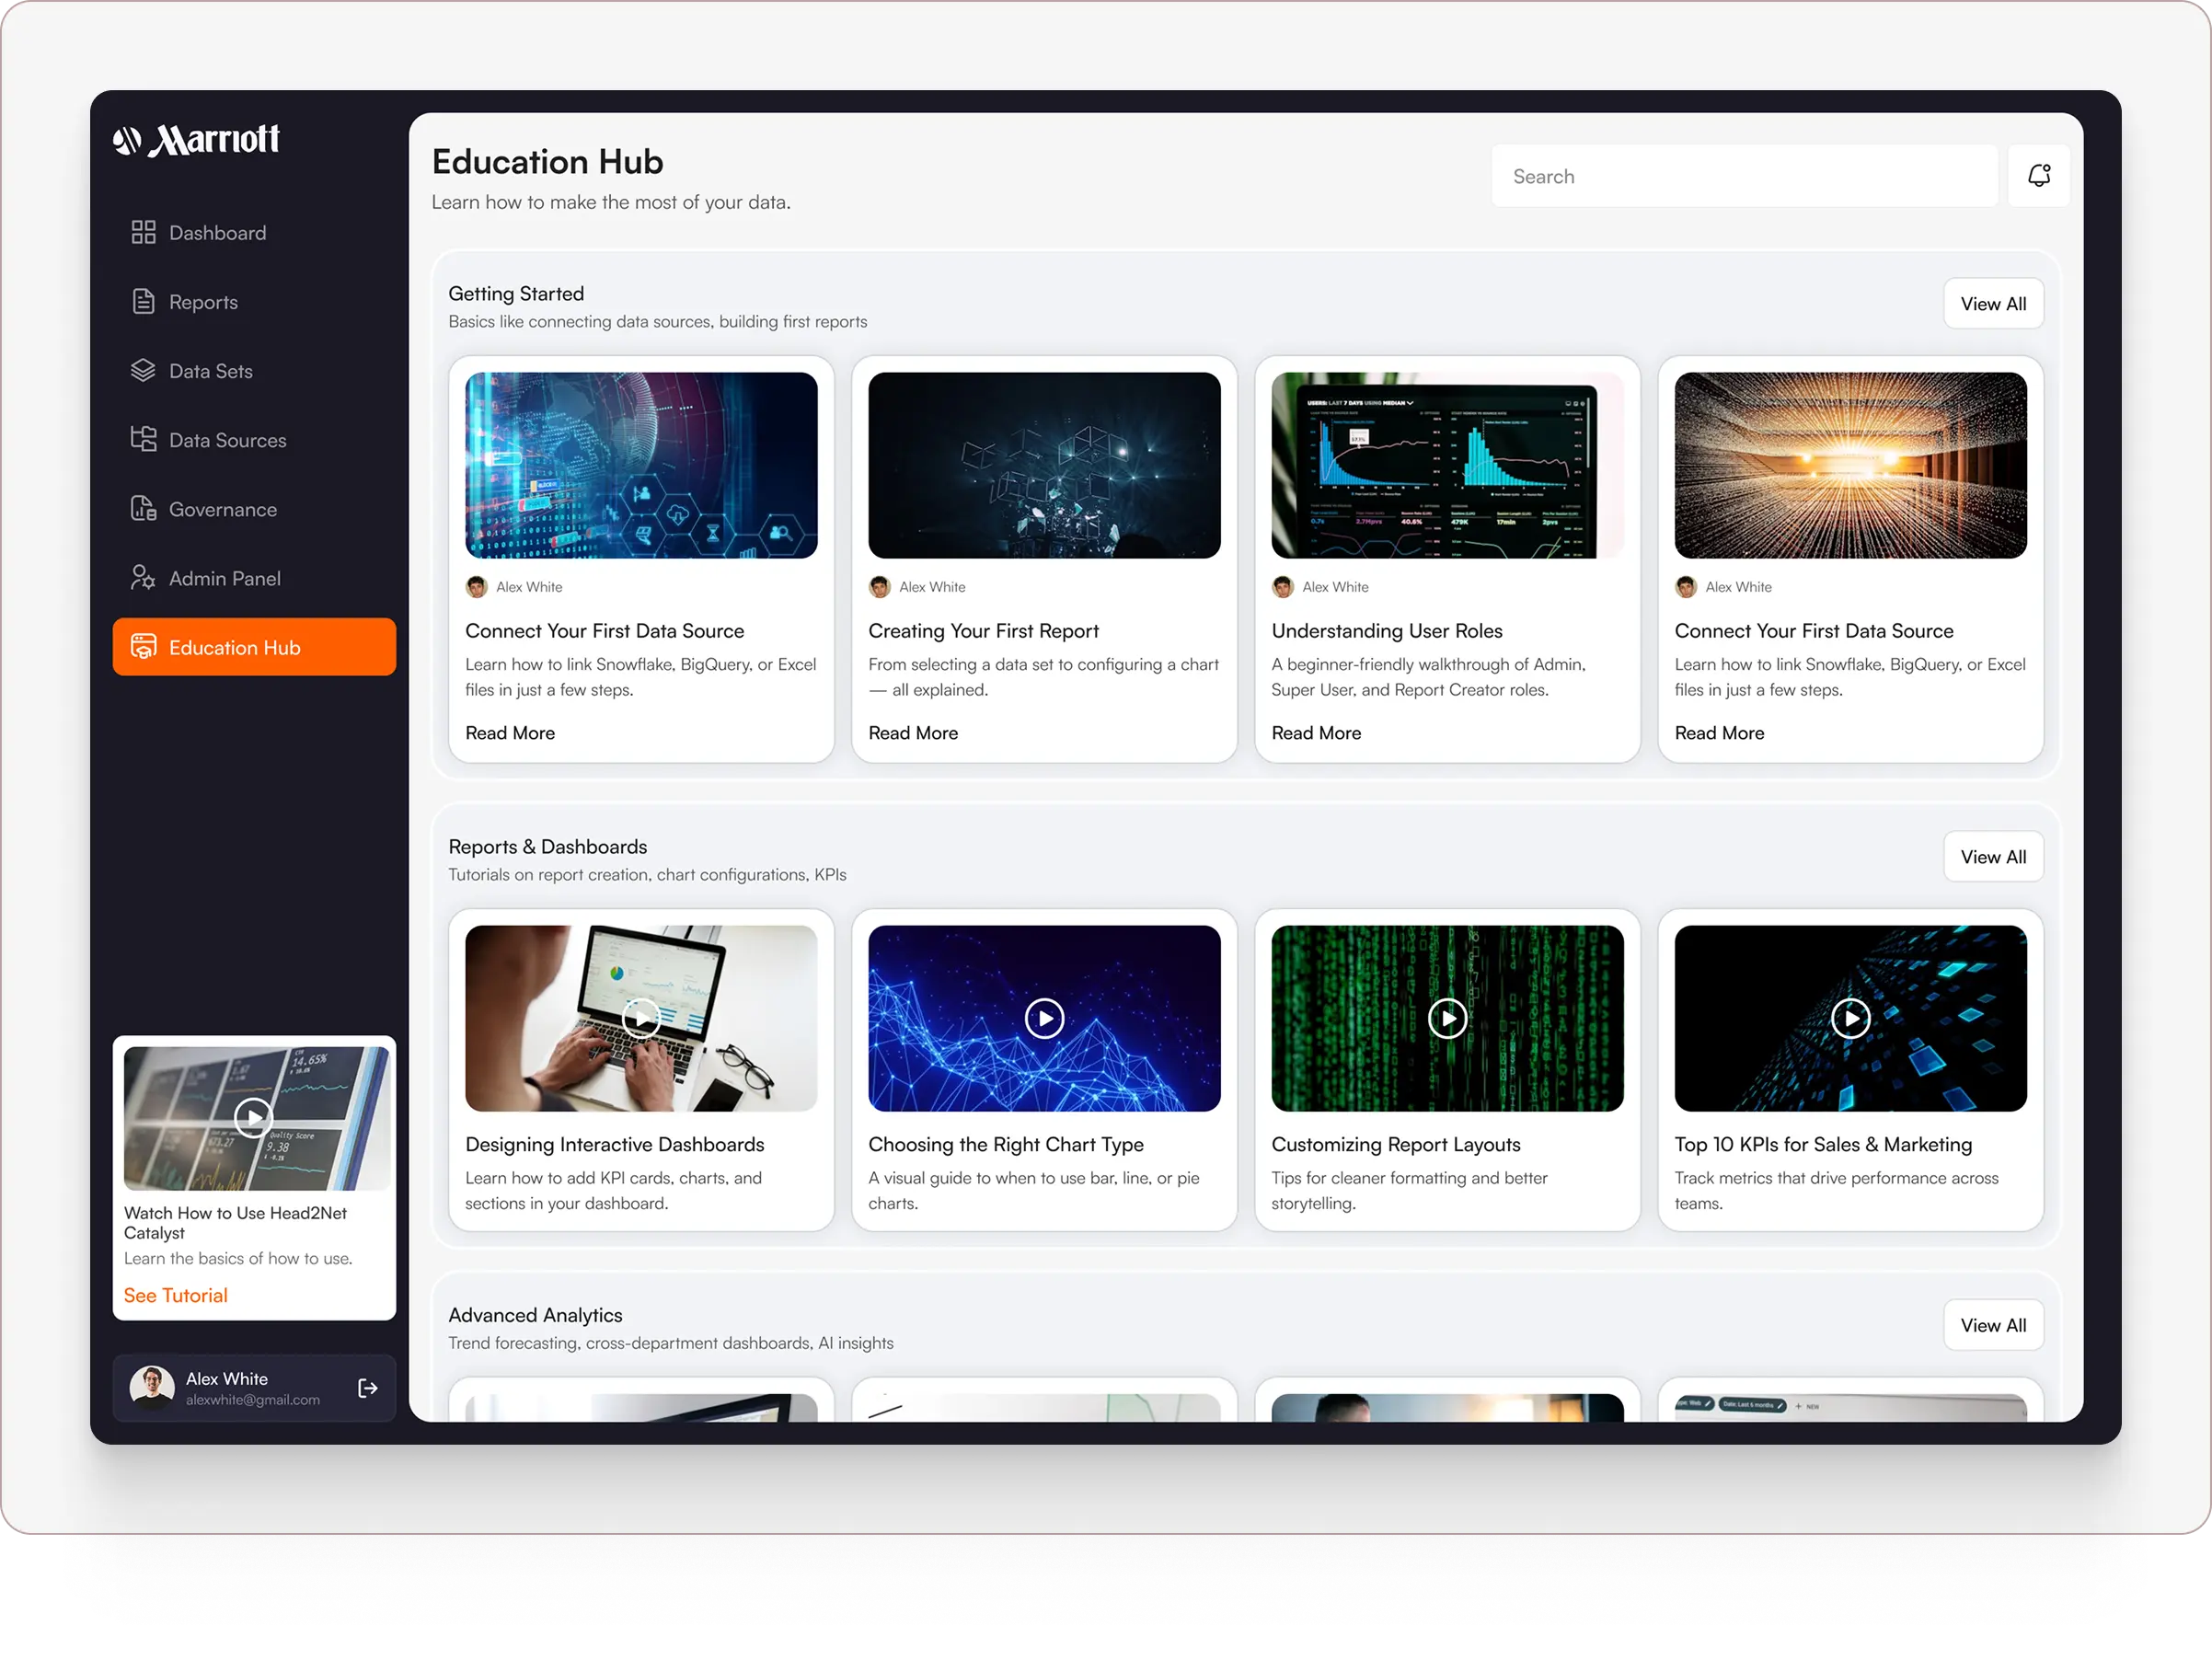
Guided learning organized around getting started, reporting, dashboards and more advanced platform capabilities.
Guided learning organized around getting started, reporting, dashboards and more advanced platform capabilities.
07 - THE DESIGN OUTCOME
A coherent product experience, from data connection to business reporting.
The Merc delivered Catalyst's UX/UI across its core product areas—from data management and reporting to governance, administration and learning.
What began as technical requirements and early visual concepts became a structured, high-fidelity product experience prepared for developer handoff.
The design established a clearer way to navigate the platform, work with information and move between business and administrative tasks.
Core product UX/UI
Designed from requirements
Multi-role workflows
Business users and administrators
Self-service reporting
Designed experience
Figma handoff
Product design delivery
07 - THE DESIGN OUTCOME
A coherent product experience, from data connection to business reporting.
The Merc delivered Catalyst's UX/UI across its core product areas—from data management and reporting to governance, administration and learning.
What began as technical requirements and early visual concepts became a structured, high-fidelity product experience prepared for developer handoff.
The design established a clearer way to navigate the platform, work with information and move between business and administrative tasks.
Core product UX/UI
Designed from requirements
Multi-role workflows
Business users and administrators
Self-service reporting
Designed experience
Figma handoff
Product design delivery
WORK WITH THE MERC
Building software that's powerful but difficult to use?
We help software teams turn complex requirements and technical workflows into clear, usable product experiences.
Discuss your product
WORK WITH THE MERC
Building software that's powerful but difficult to use?
We help software teams turn complex requirements and technical workflows into clear, usable product experiences.
Discuss your product
WORK WITH THE MERC
Building software that's powerful but difficult to use?
We help software teams turn complex requirements and technical workflows into clear, usable product experiences.
Discuss your product
WORK WITH THE MERC
Building software that's powerful but difficult to use?
We help software teams turn complex requirements and technical workflows into clear, usable product experiences.
Discuss your product
